13. What is a Doji Candlestick?
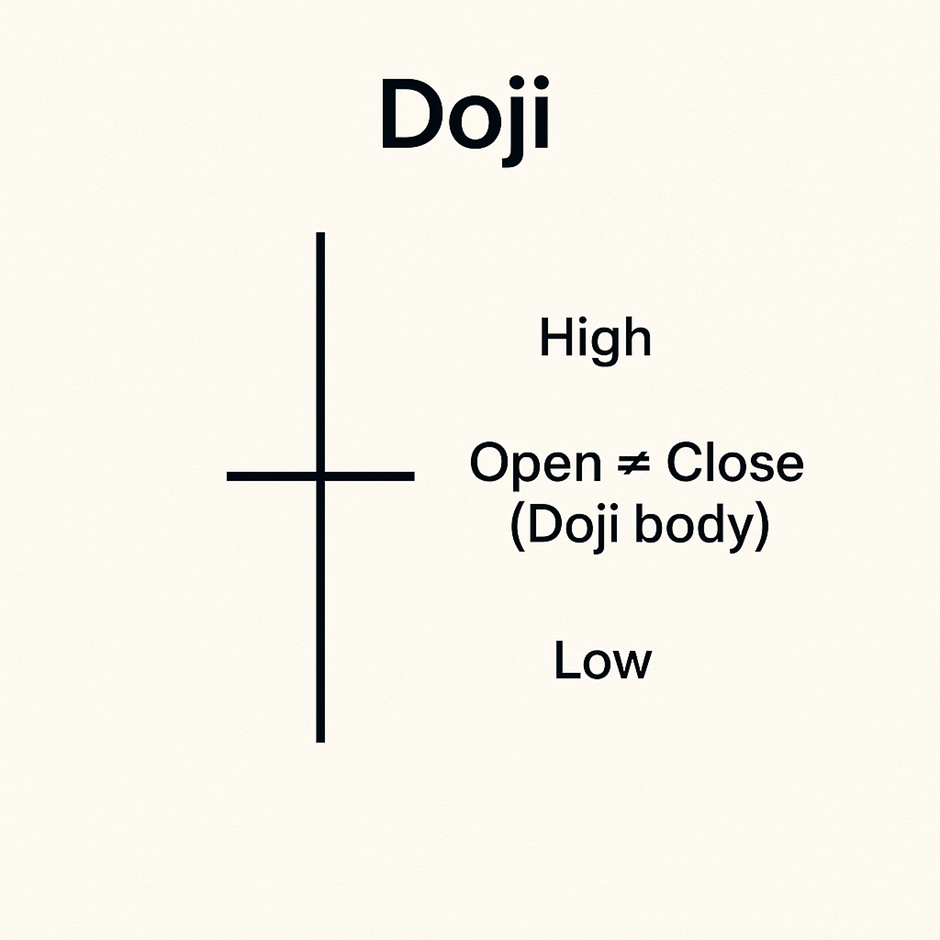
A Doji candlestick is a special pattern where the opening and closing prices are almost equal, resulting in a candle with little to no body but visible upper and lower wicks (shadows).
> “A Doji represents a tug-of-war between buyers and sellers — and neither side wins.”
It is considered a sign of market indecision or neutrality. Its position within a trend can hint at a potential pause or reversal.
Structure of a Doji
| Element | Meaning |
|---|---|
| Tiny or no body | Open ≈ Close |
| Wicks/Shadows | Price moved up and down |
| Color | Often gray or neutral |
Visual Representation of a Classic Doji
What Does a Doji Tell Traders?
- Buyers pushed price higher
- Sellers pulled it lower
- Neither side maintained control
- Result: Uncertainty, hesitation, or balance
Doji Variants & Their Meaning
| Type of Doji | Appearance | Market Insight |
|---|---|---|
| Classic Doji | Symmetrical wicks, small body | Neutral – Indecision |
| Long-Legged Doji | Very long upper & lower wicks | Extreme uncertainty, high volatility |
| Gravestone Doji | Long upper wick only | Bearish reversal after uptrend |
| Dragonfly Doji | Long lower wick only | Bullish reversal after downtrend |
How to Use Doji in Trading
A Doji alone is not a trading signal — context matters:
After a Downtrend:
- May signal selling exhaustion → Possible bullish reversal
- Especially strong if followed by a bullish candle (confirmation)
After an Uptrend:
- Could signal buyer fatigue → Possible bearish reversal
- Needs confirmation from a bearish candle the next day
Doji + Volume = Stronger Signal
- High volume Doji = greater indecision or upcoming volatility
- Volume helps validate the strength of the Doji
Real-World Example: Doji at Resistance
Stock ABC rallies from ₹500 → ₹585, then forms a Gravestone Doji at ₹590. Next day opens lower → falls to ₹570, confirming a bearish reversal.
Doji vs Other Candles
| Feature | Doji | Bullish Candle | Bearish Candle |
|---|---|---|---|
| Body Size | Tiny or none | Large green | Large red |
| Signal Type | Indecision | Buyer control | Seller control |
| Context Needed? | Yes, always | No | No |
Key Takeaways
- Occurs when open and close prices are nearly equal
- Represents market indecision or balance between buyers and sellers
- Can hint at trend reversals at key levels (support/resistance)
- Always seek confirmation from the next candle and volume
- Different types of Doji provide different reversal clues based on wick structure