16. What is a Moving Average?
A Moving Average (MA) is one of the most essential tools in technical analysis. It helps traders and investors identify the overall trend of a stock by smoothing out price fluctuations over a specific time period.
> “It filters out the market noise and reveals the real trend beneath all the daily price ups and downs.”
Rather than reacting to unpredictable daily movements, a moving average gives a clearer view of momentum — whether the market is trending up, down, or sideways.
How Does a Moving Average Work?
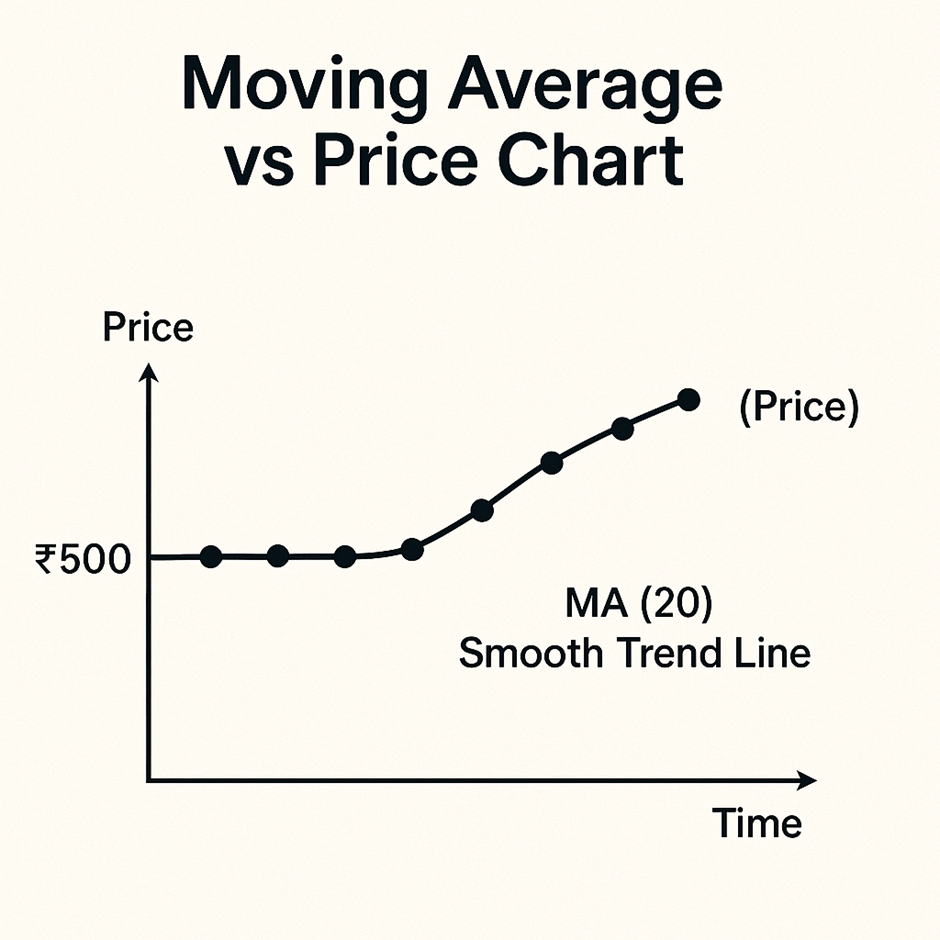
A moving average calculates the average price of a stock over a set number of periods (e.g., 10, 20, 50, 100, 200 days) and updates it as each new period passes. This produces a smooth line on the chart, highlighting the trend.
Why “moving”?
- The average recalculates with each new candle
- The line moves forward in time to reflect the latest prices
Types of Moving Averages
1. Simple Moving Average (SMA)
- Averages all closing prices equally over the period
- Example: 10-day SMA = (Sum of last 10 closing prices) ÷ 10
- Best for long-term trend tracking
2. Exponential Moving Average (EMA)
- Gives more weight to recent prices, making it more responsive
- Ideal for short-term trades or quick market reactions
- Popular among intraday and swing traders
Why Use Moving Averages?
| Purpose | Benefit |
|---|---|
| Trend Detection | Identify uptrend, downtrend, or sideways movement |
| Support/Resistance | Price often reacts near moving averages |
| Entry/Exit Signals | Crossovers or price crossing MAs signal buy/sell points |
| Confirmation Tool | Combine with indicators like RSI, MACD to validate trends |
Trend Signals from Moving Averages
Bullish Signal:
- Price above MA → uptrend / positive momentum
- Example: Nifty trades above 50-day EMA → buyers in control
Bearish Signal:
- Price below MA → downtrend / negative momentum
- Example: Tata Motors closes below 200-day SMA → potential bearish trend
Popular Strategy: Moving Average Crossovers
A crossover occurs when one MA crosses another — signaling potential trend changes.
| Crossover Type | Meaning |
|---|---|
| Golden Cross | Shorter MA (e.g., 50 SMA) crosses above longer MA (e.g., 200 SMA) → Bullish |
| Death Cross | Shorter MA crosses below longer MA → Bearish |
These crossovers are commonly used on daily and weekly charts by long-term traders.
Real-World Example: MA in Action
- Stock: Infosys Ltd
- 50-day EMA: ₹1,350
- Current price: ₹1,410
- The stock has been bouncing off the EMA for 3 weeks
Interpretation:
- 50 EMA acts as dynamic support
- Trend remains bullish as long as price stays above the moving average
Best Moving Averages by Trading Style
| Trader Type | Popular MA Settings |
|---|---|
| Intraday Traders | 5 EMA, 9 EMA, 13 EMA |
| Swing Traders | 20 EMA, 50 EMA |
| Position Traders | 100 SMA, 200 SMA |
| Investors | 50 & 200 SMA (Golden/Death Cross) |
Simplified Chart
Limitations of Moving Averages
- Lagging indicator: based on past prices → signals come after price moves
- Sideways markets: may give false signals
- Should not be used in isolation — combine with volume, RSI, or price action
Key Takeaways
- Moving Average = trend-following indicator that smooths price data
- Helps identify trend direction, confirm signals, and set support/resistance
- Two major types: SMA (simple) and EMA (exponential)
- Strategies: crossovers, price positioning, bounce setups
- Works best in trending markets, and should be combined with other indicators