3. What Are the Three Key Assumptions of Technical Analysis?
Technical analysis is grounded in three powerful assumptions that shape how price, volume, and trends are interpreted. These assumptions help traders forecast future price movements by studying historical market behaviour rather than a company’s internal fundamentals.
1. Market Discounts Everything
This is the foundation of technical analysis. It means that all available information—whether public or private, past or future—is already reflected in the current stock price.
What it includes:
- Company earnings and announcements
- Economic policies and interest rates
- Political changes, global events, even rumours and trader psychology
Example: If a company is expected to post weak quarterly results, the price may start falling days before the actual announcement, as informed traders start selling early. This proves that price leads news, not the other way around.
Takeaway: There’s no need to study financial statements. Price is the most reliable indicator of what's happening.
2. Price Moves in Trends
Another core belief is that prices follow identifiable trends rather than move randomly. Once a trend is in place, it is more likely to continue than reverse.
Types of trends:
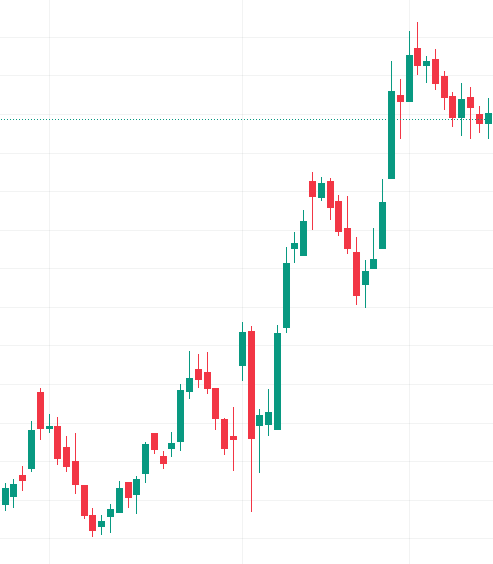
- Uptrend: Series of higher highs and higher lows
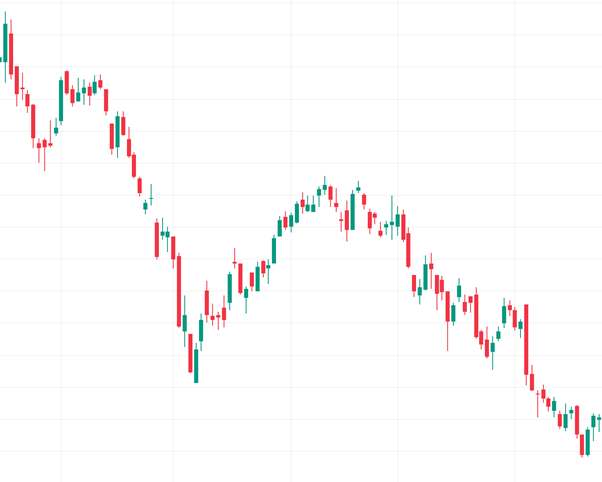
- Downtrend: Series of lower highs and lower lows
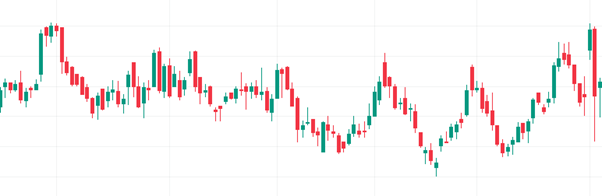
- Sideways / Range-bound: Price oscillates within a band
Visual Representation: Uptrend:
Downtrend:
Sideways:
Example: If a stock has been steadily rising for 10 days, it’s likely to continue rising unless a strong reversal signal appears.
Takeaway: Identifying and trading in the direction of the trend gives traders a statistical edge.
3. History Repeats Itself
Markets are heavily influenced by human psychology—fear, greed, hope, panic. Because human behaviour rarely changes, price patterns formed in the past tend to reappear in the future.
Why does it happen?
- Traders react to similar market conditions in similar ways.
- Chart patterns like Head & Shoulders, Triangles, and Double Tops/Bottoms occur again and again.
Example: A bullish flag pattern that worked well during a market rally in 2016 may give the same signal in 2024, because the psychology driving the pattern remains the same.
Takeaway: Learning classic patterns helps traders anticipate market behaviour and act before the crowd.
Quick Summary Table
| Assumption | Meaning |
|---|---|
| Market Discounts Everything | All known and unknown information is already priced into the market |
| Price Moves in Trends | Stocks follow trends; these trends are likely to continue |
| History Repeats Itself | Human emotions drive repeatable chart patterns and price behaviour |
Key Takeaways
- The price already knows everything—focus on price and volume, not news.
- Trends are powerful—don’t trade against them.
- Patterns work because market psychology doesn’t change.