13. What is the Price-to-Earnings (P/E) Ratio, and How is it Interpreted?
The Price-to-Earnings (P/E) Ratio is one of the most commonly used valuation tools in fundamental analysis. It tells you how much investors are willing to pay today for ₹1 of a company’s earnings.

This ratio reflects market sentiment, expectations of future earnings growth, and the perceived risk of a company’s business.
Example
Let’s say:
- Share Price = ₹500
- Earnings per Share (EPS) = ₹25
Then:
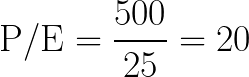
Interpretation: Investors are willing to pay ₹20 for every ₹1 of the company’s earnings.
Types of P/E
- Trailing P/E – Based on the past 12 months’ earnings (more common).
- Forward P/E – Based on forecasted earnings for the next 12 months (used in growth projections).
What Does a High or Low P/E Mean?
| P/E Value | Possible Interpretation |
|---|---|
| High P/E | - Investors expect high future growth <br> - Stock might be overvalued <br> - Common in high-growth sectors like tech, pharma |
| Low P/E | - Stock may be undervalued or ignored <br> - Company may have weak growth prospects or be cyclical <br> - Could be a value opportunity if fundamentals are strong |
When is P/E Useful?
- For comparing similar companies in the same industry
- To check whether a stock is trading at a premium or discount to peers
- As a quick gauge of market sentiment
Industry Benchmarking
P/E ratios vary by sector. For example:
- FMCG and IT → higher P/E due to consistent cash flows
- Auto or manufacturing → lower P/E due to cyclical risk
So, P/E should never be viewed in isolation. Always compare with:
- Historical P/E of the same company
- P/E of industry peers
- P/E of the overall market (e.g., Nifty 50 average P/E)
PEG Ratio: A Better View?
To overcome P/E’s limitation of ignoring growth, investors use the PEG Ratio:

- PEG < 1: Stock may be undervalued relative to its growth
- PEG > 1: Stock may be overvalued
Limitations of P/E
- Can be manipulated by accounting methods (e.g., non-cash income)
- Doesn’t account for growth potential or debt levels
- Not useful for loss-making companies (since EPS is negative or zero)
Key Takeaways
- The P/E Ratio shows how much investors are paying for each rupee of earnings.
- High P/E = higher growth expectations or overvaluation.
- Low P/E = undervaluation or weak growth confidence.
- Always interpret P/E in the context of industry, peers, and history.
- Best used with other metrics like PEG ratio, RoE, and cash flow for a balanced view.