15. How Does the Debt-to-Equity Ratio Impact a Company's Financial Health?
The Debt-to-Equity (D/E) Ratio is one of the most important indicators in fundamental analysis for assessing a company’s financial structure, risk profile, and long-term solvency. It tells us how much of a company’s funding comes from debt (borrowed capital) versus equity (shareholders’ funds).

This ratio provides insight into how aggressively a company is financing its operations and growth, and how well it might withstand business cycles or financial shocks.
Breaking Down the Components
- Total Debt
Includes:
- Short-term borrowings
- Long-term debt (bank loans, debentures, bonds)
- Lease obligations (if treated as debt under accounting standards)
- Shareholders' Equity
Includes:
- Equity capital (shares issued)
- Retained earnings (profits reinvested)
- Reserves (like securities premium, general reserve)
Why Is the D/E Ratio So Important?
Because debt and equity behave very differently:
| Feature | Debt | Equity |
|---|---|---|
| Ownership | Creditors (no ownership) | Shareholders (owners) |
| Repayment Obligation | Must be repaid with interest | No obligation to repay |
| Cost | Fixed (interest) | Variable (dividends, dilution) |
| Risk Level | Increases financial risk | Absorbs business risk |
The D/E ratio measures how much risk the company is taking by using debt, and whether it’s balanced enough to sustain operations even during lean periods.
Interpreting the Ratio
| D/E Ratio Range | What It Means |
|---|---|
| < 1.0 | More equity than debt → conservative structure, lower risk |
| 1.0 – 2.0 | Balanced use of debt and equity, often seen in healthy businesses |
| > 2.0 | Debt-heavy company → higher leverage, more risk (may also mean faster expansion) |
- A very high D/E could signal over-leverage.
- A very low D/E may indicate underutilization of low-cost capital (especially if high growth opportunities exist).
Real-World Example
Company A:
- Total Debt: ₹500 crore
- Shareholders’ Equity: ₹250 crore
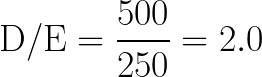
This means for every ₹1 of equity, the company has ₹2 of debt. While this may accelerate growth, it also increases repayment obligations and financial risk.
Impact of High vs Low D/E on Financial Health
| High D/E Ratio | Low D/E Ratio |
|---|---|
| Greater dependency on external financing | Relies more on internal funds |
| Higher interest obligations → profit pressure | More room to borrow during downturns |
| May affect credit rating and borrowing capacity | Seen as conservative (lower growth) |
| Exposed to rising interest rates | More resilience in high-rate environment |
| Higher risk in uncertain conditions | Safer financial position |
Industry Norms Matter
Different industries have different ideal D/E ratios depending on their capital intensity:
| Industry | Typical D/E Ratio |
|---|---|
| IT & Software | Low (0.1 – 0.5) |
| Consumer Goods (FMCG) | Low (0.2 – 0.6) |
| Automobile | Moderate (0.5 – 1.0) |
| Banking & Finance | High (regulated) |
| Infrastructure/Realty | High (1.5 – 3.0) |
| Pharmaceuticals | Moderate |
Comparing a capital-light business like TCS with a high-debt real estate company like DLF wouldn’t be meaningful without industry context.
Debt vs Equity in Market Cycles
- Bull Market: High D/E companies can deliver strong returns due to leveraged growth.
- Bear Market: High D/E companies suffer more from fixed interest obligations and falling revenues.
- Low D/E companies: Better positioned to survive downturns.
Relationship with Other Ratios
- RoE can be boosted artificially through debt (financial leverage). A rising RoE should be evaluated alongside D/E.
- Interest Coverage Ratio (EBIT ÷ Interest Expense) complements D/E by showing repayment ability.
- Debt-to-Assets Ratio gives a fuller picture of leverage.
Risk Indicators for Investors
- D/E is rising faster than asset or profit growth
- Debt being used to pay dividends or buy back shares instead of expansion
- Low interest coverage ratio (<1.5)
- Company repeatedly rolling over debt without repayment
Key Takeaways
- The Debt-to-Equity Ratio shows how a company finances growth — via shareholder capital or external borrowing.
- A balanced D/E helps optimize returns while keeping risk manageable.
- The ratio should always be interpreted in context of:
- Industry norms
- Company growth stage
- Interest rate environment
- Cash flow strength
- Used wisely, D/E is a powerful tool for identifying financially sound businesses with the right balance of risk and reward.