5. What is Return on Equity (ROE)?
Return on Equity (ROE) is one of the most widely used financial ratios by equity investors, analysts, and management to assess a company’s ability to generate profit from the money shareholders have invested. It directly tells you how much return a company is generating for its equity holders. In essence: ROE = “How many rupees of profit does the company make for every rupee invested by shareholders?” A high ROE typically signals strong financial health, effective management, and shareholder-friendly operations.
ROE Formula
Return on Equity (ROE) = (Net Profit / Shareholders’ Equity) × 100
- Net Profit: Also known as net income or bottom-line profit after tax, interest, and all expenses.
- Shareholders' Equity: Total equity available to shareholders, including retained earnings and capital.
What ROE Tells You
ROE measures the efficiency with which a company uses its shareholders’ capital to produce net profits. If a company has an ROE of 20%, it means it generated ₹20 in profit for every ₹100 of equity invested by shareholders.
Categories of ROE
| ROE Range | Meaning |
|---|---|
| 20% and above | Excellent – indicates strong profitability and capital use |
| 15%–20% | Good – consistent with well-run firms in growth sectors |
| 10%–15% | Acceptable – often seen in stable or asset-heavy businesses |
| Below 10% | Caution – could mean inefficient use of capital |
| Negative ROE | Red flag – the company is losing money or has negative equity |
Example: How to Calculate ROE
Assume a company reports:
- Net Profit: ₹12 crore
- Shareholders’ Equity: ₹60 crore
ROE = (12 / 60) × 100 = 20% This means the company earns ₹20 for every ₹100 invested by its shareholders.
What’s Included in Shareholders’ Equity?
| Component | Description |
|---|---|
| Common Stock | Value of issued shares |
| Retained Earnings | Profits kept in the company over time |
| Additional Paid-in Capital | Capital paid by shareholders above face value |
Real-World Company Comparison (FY24 Estimates)
| Company | Net Profit (₹ Cr) | Equity (₹ Cr) | ROE (%) |
|---|---|---|---|
| TCS | 42,303 | 98,603 | 42.9 |
| Infosys | 24,108 | 83,150 | 29 |
| Wipro | 11,420 | 57,000 | 20 |
| HUL | 9,881 | 47,000 | 21 |
TCS shows a superior ROE, indicating highly efficient use of shareholder funds, driven by scalable operations and consistent profitability.
Why ROE Matters for Investors
| Benefit | Explanation |
|---|---|
| Measures Profitability | Helps assess how effectively a company converts equity into earnings. |
| Reflects Management Quality | High ROE implies strong capital deployment and cost control. |
| Useful in Stock Screening | Investors can identify consistently profitable businesses. |
| Enables Peer Comparison | Levels the field across companies of different sizes. |
DuPont Analysis: Breaking Down ROE
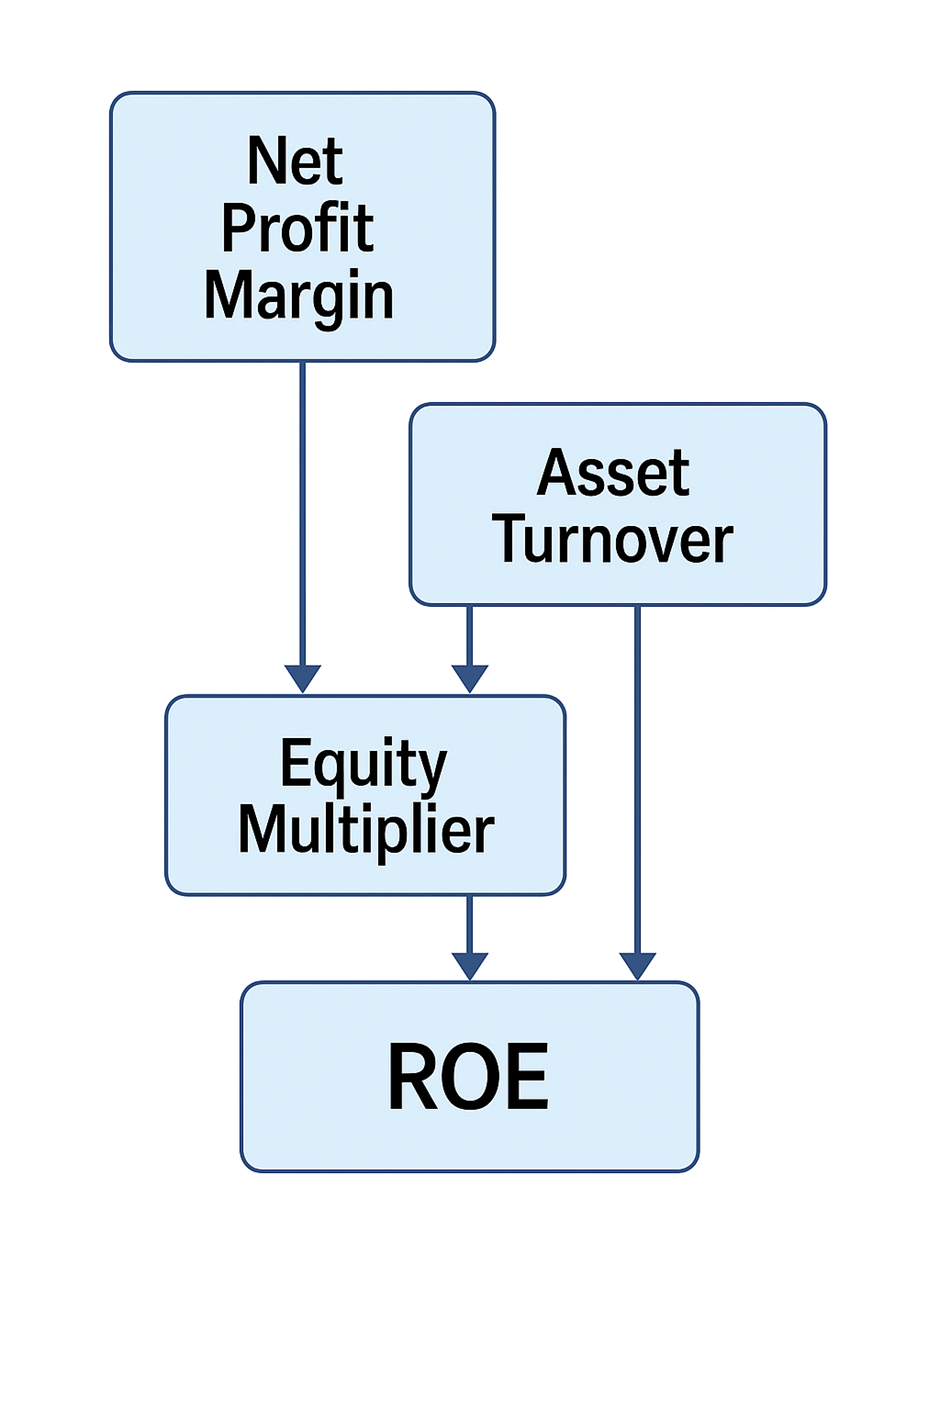
To understand what’s driving ROE, analysts use the DuPont Formula:
ROE = Net Profit Margin × Asset Turnover × Equity Multiplier
| Component | Meaning |
|---|---|
| Net Profit Margin | How much profit is earned per rupee of sales |
| Asset Turnover | How efficiently assets generate revenue |
| Equity Multiplier | How much of the business is financed by equity vs debt |
DuPont ROE = Operational Efficiency × Asset Use Efficiency × Leverage
Key Scenarios
- High ROE with Low Debt
- Positive: Indicates a highly efficient and financially strong company.
- High ROE with High Debt (High Equity Multiplier)
- Warning: Profitability might be inflated due to debt. Could be risky.
- Declining ROE Over Time
- Red Flag: Could signal declining margins, rising equity base without proportional profit growth.
Limitations of ROE
| Limitation | Why It Matters |
|---|---|
| Debt Can Skew ROE | High debt can artificially boost ROE through a smaller equity base. |
| Negative Equity Issue | If equity becomes negative, ROE becomes meaningless. |
| Ignores Risk | ROE doesn’t factor in how much risk was taken to earn profit. |
| Industry Variations | ROE should only be compared within the same industry. |
Best Practices for Using ROE
- Compare ROE with peers in the same industry
- Track ROE trends over multiple years
- Use alongside ROA (Return on Assets) and ROIC (Return on Invested Capital)
- Examine DuPont components to avoid being misled by leverage-driven ROE
Key Takeaways
- ROE reveals how efficiently equity capital is used to generate profit.
- Higher ROE is typically better—especially if it's sustainable and not driven by high debt.
- Use DuPont Analysis to understand what's really driving ROE.
- It is a must-use metric when comparing profitability across companies from a shareholder’s lens.