18. What is a Crossover Strategy?
A crossover strategy is a popular trend-following trading method where two moving averages — one short-term and one long-term — are plotted on a chart. When the short-term moving average crosses above or below the long-term moving average, it generates a buy or sell signal.
> “A crossover indicates a shift in market momentum — like a green light or red flag for your trade.”
How It Works
- Short-Term MA: Responds quickly to price changes (e.g., 10-day or 20-day EMA)
- Long-Term MA: Smoother and slower, reflects the broader trend (e.g., 50-day or 200-day SMA)
Crossover Signal: When the short-term MA crosses the long-term MA, it indicates a potential trend change.
Types of Crossover Signals
| Crossover Type | What Happens | Signal |
|---|---|---|
| Bullish Crossover (Golden Cross) | Short-term MA crosses above long-term MA | Buy Signal |
| Bearish Crossover (Death Cross) | Short-term MA crosses below long-term MA | Sell Signal |
Golden Cross (Bullish Signal)
- Short-term MA crosses above long-term MA (e.g., 50-day SMA > 200-day SMA)
- Indicates rising momentum and a potential uptrend
- Traders often enter long positions
Example: If the 50-day SMA crosses above the 200-day SMA on NIFTY, many view it as a long-term bullish signal.
Death Cross (Bearish Signal)
- Short-term MA crosses below long-term MA
- Signals weakening momentum and potential downtrend
- Often used to exit long positions or initiate short trades
Example: A 20-day EMA crossing below the 50-day EMA on Reliance may indicate a short-term reversal or correction.
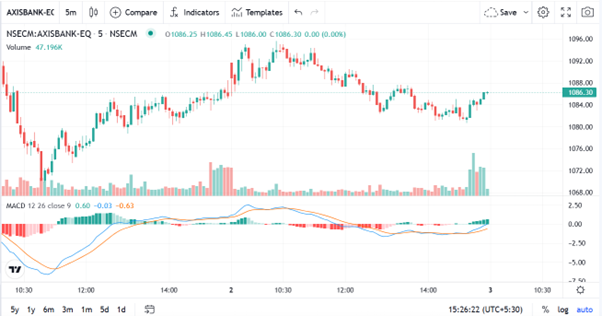
Visual (Text Format)
Why Is the Crossover Strategy Popular?
- Simple to understand and apply
- Reduces emotional decision-making
- Works well in trending markets
- Applicable across any timeframe: intraday, daily, weekly
Common Moving Average Pairs
| Trading Style | Short-Term MA | Long-Term MA | Best For |
|---|---|---|---|
| Intraday | 5 EMA | 20 EMA | Quick trades |
| Swing Trading | 20 EMA | 50 SMA | Short to medium-term trends |
| Long-Term Investing | 50 SMA | 200 SMA | Identifying bull/bear cycles |
Limitations of the Crossover Strategy
- Lagging indicator — signals appear after trend starts
- False signals in sideways or choppy markets
- Best used only in clearly trending markets
How to Improve Accuracy
- Combine with RSI or MACD to reduce false signals
- Use support/resistance or volume confirmation
- Apply stop-loss and target levels to manage risk
Key Takeaways
- A crossover strategy uses two moving averages to generate buy/sell signals
- Golden Cross = Buy, Death Cross = Sell
- Best applied in trending markets, not sideways ranges
- Works across stocks, indices, commodities, crypto, and all timeframes
- Combine with other indicators for stronger confirmation