19. What is MACD (Moving Average Convergence Divergence)?
MACD, or Moving Average Convergence Divergence, is a momentum and trend-following indicator used in technical analysis. It helps traders understand trend direction, momentum strength, and possible entry or exit points by comparing two moving averages of a stock’s price.
> “MACD reveals changes in momentum before price does — making it a powerful early signal tool.”
How MACD Works
MACD is composed of three components:
| Component | What It Does |
|---|---|
| MACD Line | Difference between 12-day EMA and 26-day EMA (fast – slow EMA) |
| Signal Line | 9-day EMA of the MACD Line |
| Histogram | Difference between MACD Line and Signal Line (shown as bars) |
> All values are calculated using closing prices.
MACD Chart Example (Simplified View)
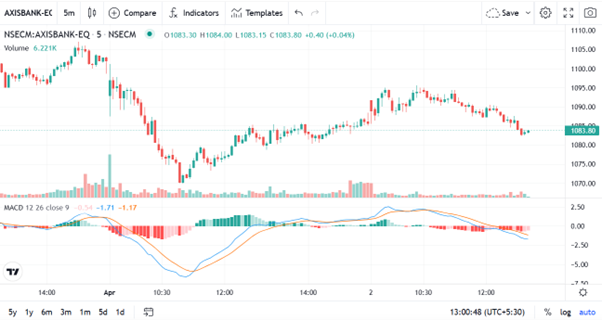
MACD Crossover Strategy
| Signal | What Happens | What It Means |
|---|---|---|
| MACD Line crosses above Signal Line | Bullish crossover | Buy Signal – Trend gaining momentum |
| MACD Line crosses below Signal Line | Bearish crossover | Sell Signal – Trend weakening |
Histogram: Visualizing Momentum
- Bars above zero line → bullish strength
- Bars below zero line → bearish pressure
- Growing bars = increasing momentum
- Shrinking bars = waning strength
MACD vs RSI – Key Difference
| Indicator | Measures | Best For |
|---|---|---|
| MACD | Trend & momentum | Entry/exit signals |
| RSI | Overbought/oversold zones | Spotting potential reversals |
> Combining both can provide stronger confirmation for trades.
How Traders Use MACD
- Identify early trend shifts
- Spot momentum breakouts
- Time entries and exits
- Confirm signals from price patterns and candlestick formations
MACD Divergence = Warning Signal
| Type of Divergence | What It Means |
|---|---|
| Bullish Divergence | Price makes lower lows, but MACD makes higher lows → Possible upside reversal |
| Bearish Divergence | Price makes higher highs, but MACD makes lower highs → Potential downtrend ahead |
MACD Settings (Default)
- Fast EMA: 12
- Slow EMA: 26
- Signal Line EMA: 9
> You can customize these based on your timeframe or trading style.
Key Takeaways
- MACD combines moving averages to show trend direction and strength
- Crossover between MACD line and Signal line = buy/sell signals
- Histogram shows momentum visually
- Watch for divergences between MACD and price
- Suitable for all asset classes and timeframes: stocks, indices, crypto, intraday to long-term