6. How Do You Draw an Uptrend Line?
An uptrend line is one of the most powerful tools in technical analysis. It helps traders visualize bullish market momentum, identify support levels, and make informed buy decisions.
> “An uptrend line shows that bulls are in control—and getting stronger.”
Drawing an uptrend line isn’t just about connecting points on a chart — it’s about understanding the psychology of higher lows, which reflect increasing investor confidence.
What Is an Uptrend Line?
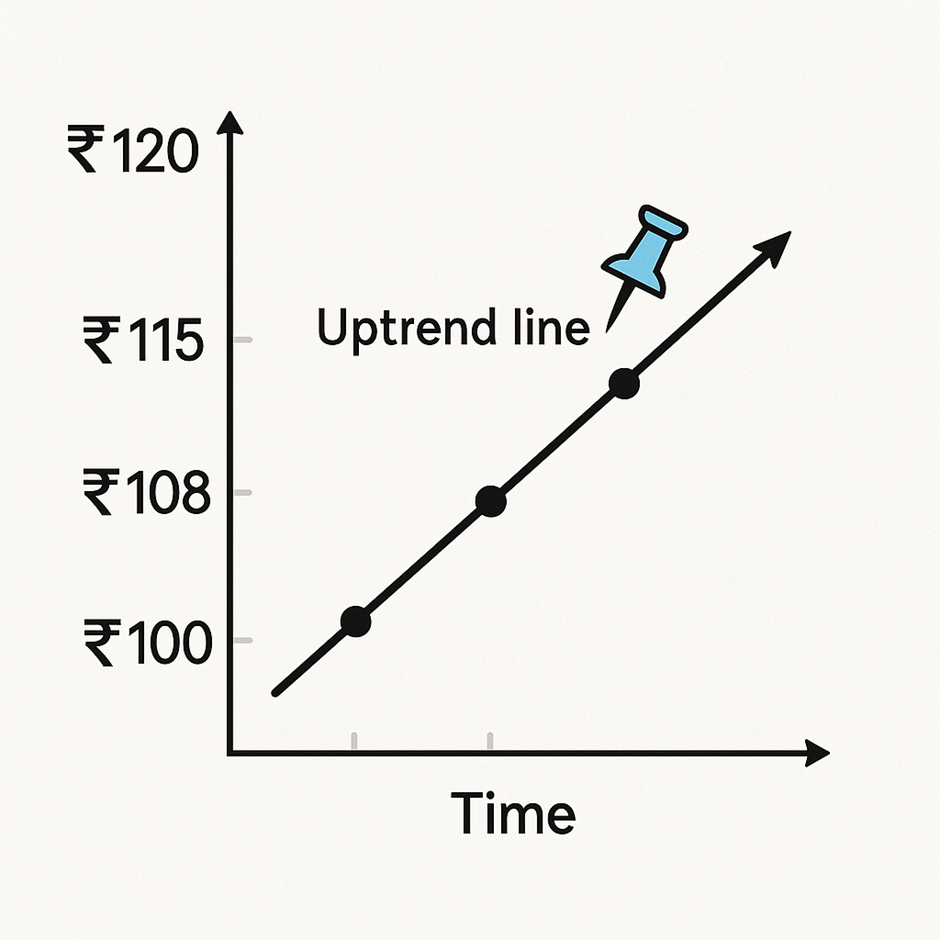
An uptrend line is a diagonal support line that connects two or more rising swing lows (higher lows) on a price chart. It indicates that buyers are stepping in earlier each time, pushing prices higher.
Why Use an Uptrend Line?
- Confirms bullish market direction
- Acts as a support level
- Helps identify entry points on pullbacks
- Signals potential trend reversal when broken
- Useful for stop-loss placement
Step-by-Step: How to Draw an Uptrend Line
Step 1: Identify the Swing Lows (Higher Lows)
Look for two or more low points in the price chart where the stock reversed upward. These are called swing lows.
| Date | Price | Label |
|---|---|---|
| Jan-02 | ₹100 | First swing low |
| Jan-06 | ₹108 | Second higher low |
| Jan-10 | ₹115 | Third higher low |
Step 2: Connect the Lows with a Straight Line
Using a trendline tool on your charting platform:
- Connect the first low to the second higher low
- Extend the line to the right, projecting future price support
> The more points the trendline touches, the stronger and more valid it becomes.
Step 3: Extend and Observe
Let the trendline continue forward. This line becomes your reference point:
- When price touches it and bounces → trend is healthy
- When price breaks below it with volume → potential trend reversal
Visual Example
Example: Real-World Scenario
Infosys stock moves as follows:
- Day 1: ₹1,200 (swing low)
- Day 4: ₹1,240 (next low, but higher)
- Day 8: ₹1,280 (third low)
Draw a line connecting ₹1,200 → ₹1,240 → ₹1,280. Whenever the price pulls back near this line and bounces, it confirms continued bullish strength.
When to Use the Uptrend Line
| Purpose | How It Helps |
|---|---|
| Entry Timing | Enter trades on pullbacks near the trendline |
| Risk Management | Place stop-loss slightly below the trendline |
| Trend Confirmation | Verify if the stock is still bullish |
| Reversal Alerts | A break below the trendline may signal weakness |
Common Mistakes to Avoid
- Forcing a line to fit random price points
- Using only one low — you need at least two
- Ignoring volume — confirm trendline strength with volume
- Not adjusting the line when new swing lows form
Best Practices
- Use 3+ touchpoints for a strong trendline
- Combine with RSI or MACD for extra confirmation
- Always watch for false breakdowns (price temporarily dips below and recovers)
Key Takeaways
- An uptrend line connects two or more higher lows, forming a diagonal support line.
- It helps visualize bullish momentum and plan entries during pullbacks.
- A break below the line could indicate a weakening trend or reversal.
- Strong trendlines are supported by volume and multiple touchpoints.