7. What is a Support Level?
A support level is a critical concept in technical analysis. It refers to a specific price zone where a stock repeatedly finds buying interest, preventing it from falling further. Support levels act like a psychological “floor” that price tends to bounce off when reached.
> Think of support as the level where buyers say: > “This stock is cheap — let’s buy!”
Why Does Support Form?
Support is created when demand increases significantly at a certain price level, due to one or more of the following reasons:
- Historical price behaviour – Traders remember that price bounced from this level in the past
- Psychological price points – Round numbers like ₹100, ₹500, ₹1,000 often attract attention
- Valuation perception – Fundamental investors may see this level as undervalued
- Institutional buying – Big players (mutual funds, FIIs) often place large buy orders near support
Support in Action: A Realistic Example
Let’s say the stock of HDFC Bank has recently bounced from ₹1,480 several times:
| Date | Price Action | What Happened |
|---|---|---|
| Mar-05 | ₹1,550 → ₹1,480 | Support tested and held |
| Mar-11 | ₹1,530 → ₹1,480 | Buyers stepped in at same level |
| Mar-18 | ₹1,500 → ₹1,480 | Reaffirmed support strength |
This repeated behaviour reinforces ₹1,480 as a strong support level.
Support Level – Visual Representation
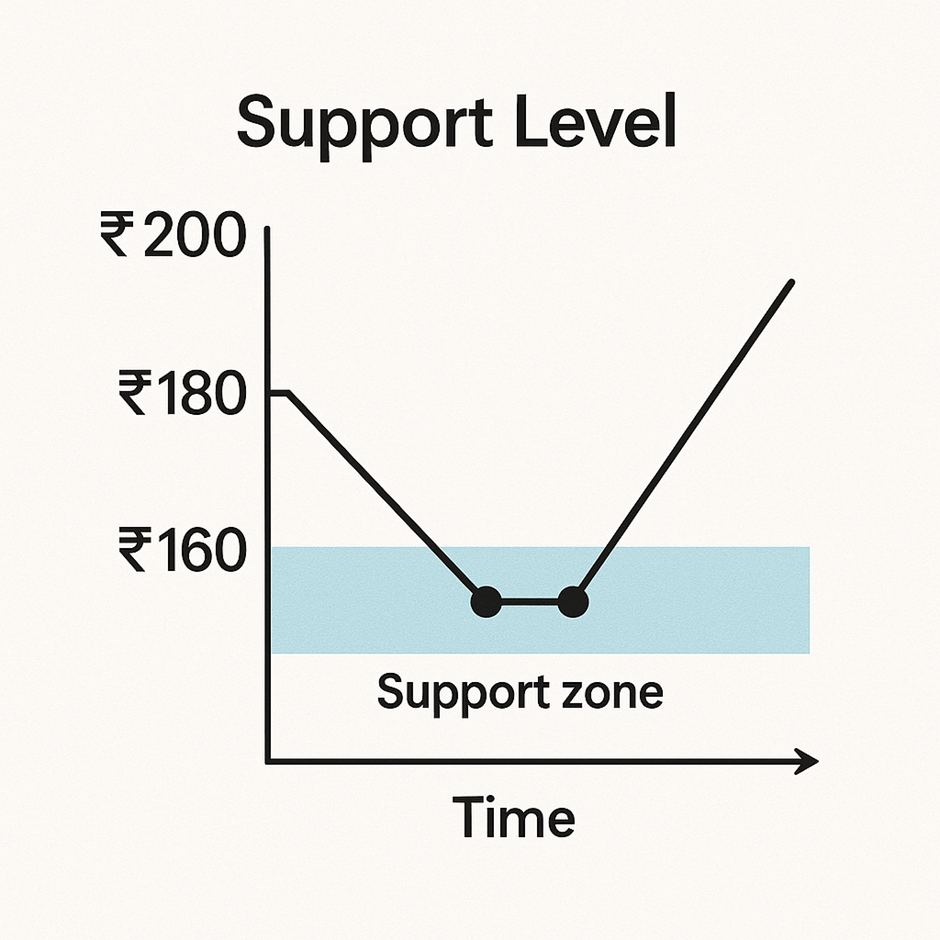
Each time the price touches the ₹1,480 zone and bounces back, it indicates that buyers are absorbing selling pressure, keeping the price from falling further.
How to Identify Support Levels
- Look for areas where price repeatedly stopped falling
- Confirm with volume spikes at those levels (indicating strong buying)
- Use candlestick reversal patterns (like hammer or bullish engulfing) near those levels
- Plot horizontal lines across previous swing lows
How Traders Use Support Levels
| Use Case | Purpose |
|---|---|
| Entry Signal | Buy near support expecting a bounce |
| Stop-Loss Setup | Place stop-loss slightly below support |
| Breakout Setup | If support breaks, consider short opportunities |
| Confirmation Tool | Combine with indicators (like RSI, MACD) for confirmation |
> Pro tip: A bounce on support + bullish candlestick pattern + volume spike = Strong buy signal
What Happens If Support Breaks?
A support break occurs when the price falls below the support zone with strong volume. This could signal:
- A trend reversal (from uptrend to downtrend)
- Stop-loss triggers, leading to panic selling
- The broken support now becomes new resistance (role reversal)
Example: ₹1,480 support breaks → stock drops to ₹1,400. Later, when price rises again, ₹1,480 acts as resistance, stopping the upward move.
Support vs Resistance – Quick Recap
| Support | Resistance |
|---|---|
| Price stops falling | Price stops rising |
| Acts as floor | Acts as ceiling |
| Zone of buying interest | Zone of selling pressure |
| Signals entry/bounce zone | Signals exit/sell zone |
Psychological Insight Behind Support
- Traders remember where price bounced previously
- Fear of missing out (FOMO) kicks in when prices approach past support
- Market participants anticipate the same result — creating self-fulfilling buying pressure
Key Takeaways
- A support level is a price point where demand is strong enough to prevent further decline
- Support is formed through repeated bounces from the same price zone
- Traders use support for buy entries, stop-loss placement, and risk control
- A break below support can signal weakness and potential trend reversal
- Support can flip into resistance if the price breaks below it