10. What is the Interest Coverage Ratio?
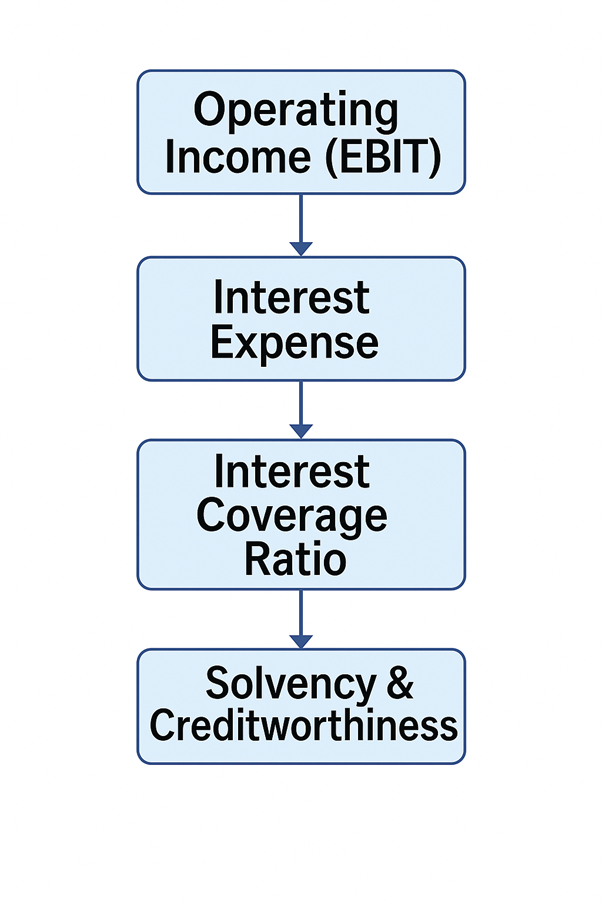
The Interest Coverage Ratio is a type of solvency ratio that measures a company’s ability to meet its interest obligations on outstanding debt using its operating profit or earnings before interest and taxes (EBIT). In simple terms: Interest Coverage Ratio answers: “How many times can the company cover its interest expense with its operating income?” This is a critical indicator for creditors, banks, bondholders, and investors to assess the company’s financial stability and creditworthiness.
Formula
Interest Coverage Ratio = EBIT / Interest Expense
- EBIT (Earnings Before Interest and Taxes): Also known as operating income—profit before financing and tax expenses.
- Interest Expense: The cost incurred by the company for borrowed funds (loans, bonds, leases).
What It Indicates
| Ratio Value | Interpretation |
|---|---|
| > 3.0 | Comfortable—strong ability to service interest payments |
| 1.5 – 3.0 | Moderate—may handle interest, but could face pressure if profits fall |
| < 1.5 | Risk zone—difficulty in meeting interest payments |
| < 1.0 | Red flag—the company earns less than it owes in interest |
Example Calculation
Suppose a company has:
- EBIT = ₹60 crore
- Interest Expense = ₹15 crore
Interest Coverage Ratio = 60 / 15 = 4.0
Interpretation: The company can pay its interest expense four times over with its operating income — a strong sign of solvency.
Real-World Example (FY24 Estimates)
| Company | EBIT (₹ Cr) | Interest Expense (₹ Cr) | Interest Coverage Ratio |
|---|---|---|---|
| Infosys | 27,000 | 0 | ∞ (no debt) |
| Tata Motors | 12,000 | 4,800 | 2.5 |
| Adani Power | 5,000 | 3,300 | 1.5 |
- Infosys: No debt = no interest = no coverage issue.
- Tata Motors: Moderate buffer for debt servicing.
Visual Flow: How It Works
Why It Matters
| Stakeholder | Use of the Ratio |
|---|---|
| Lenders | To assess loan repayment ability before sanctioning debt |
| Investors | To check whether a company is burdened by debt |
| Credit Rating Agencies | Use it to assign debt ratings |
| Management | To ensure the firm can handle its debt in business cycles |
Sector-Wise Expectations
| Industry | Typical Range | Comments |
|---|---|---|
| IT/Services | Very high or N/A | Often debt-free |
| Manufacturing | 3.0–5.0 | Depends on capex intensity |
| Utilities/Power | 1.5–3.0 | Acceptable if cash flows are stable |
| Airlines, Infra | <2.0 common | Highly leveraged industries |
Advantages of a High Ratio
- Financial flexibility during downturns
- Easier access to new credit or refinancing
- Lower cost of borrowing
- Higher investor confidence
Risks of a Low Ratio
- Liquidity crises during profit drops
- Risk of default and bankruptcy
- Poor credit ratings
- Restrictions from lenders (covenants)
Limitations
| Limitation | Reason |
|---|---|
| Ignores Principal Repayment | Only focuses on interest, not total debt repayment |
| Based on EBIT not Cash | EBIT is accounting-based; doesn’t reflect real cash flow |
| Can be manipulated via accounting | Non-cash income or capitalized interest can inflate EBIT |
| Doesn’t consider future obligations | Ignores balloon payments or refinancing risk |
Key Takeaways
- Interest Coverage Ratio measures how easily a company can pay its interest obligations using operating income.
- A higher ratio indicates financial strength and safety, while a lower ratio warns of debt servicing difficulties.
- Widely used by lenders, investors, and rating agencies to evaluate credit risk.
- Should be used alongside leverage ratios like Debt-to-Equity and Cash Flow to Debt for a complete picture.
- Varies significantly by industry and must be interpreted contextually.