11. What Are Valuation Ratios?
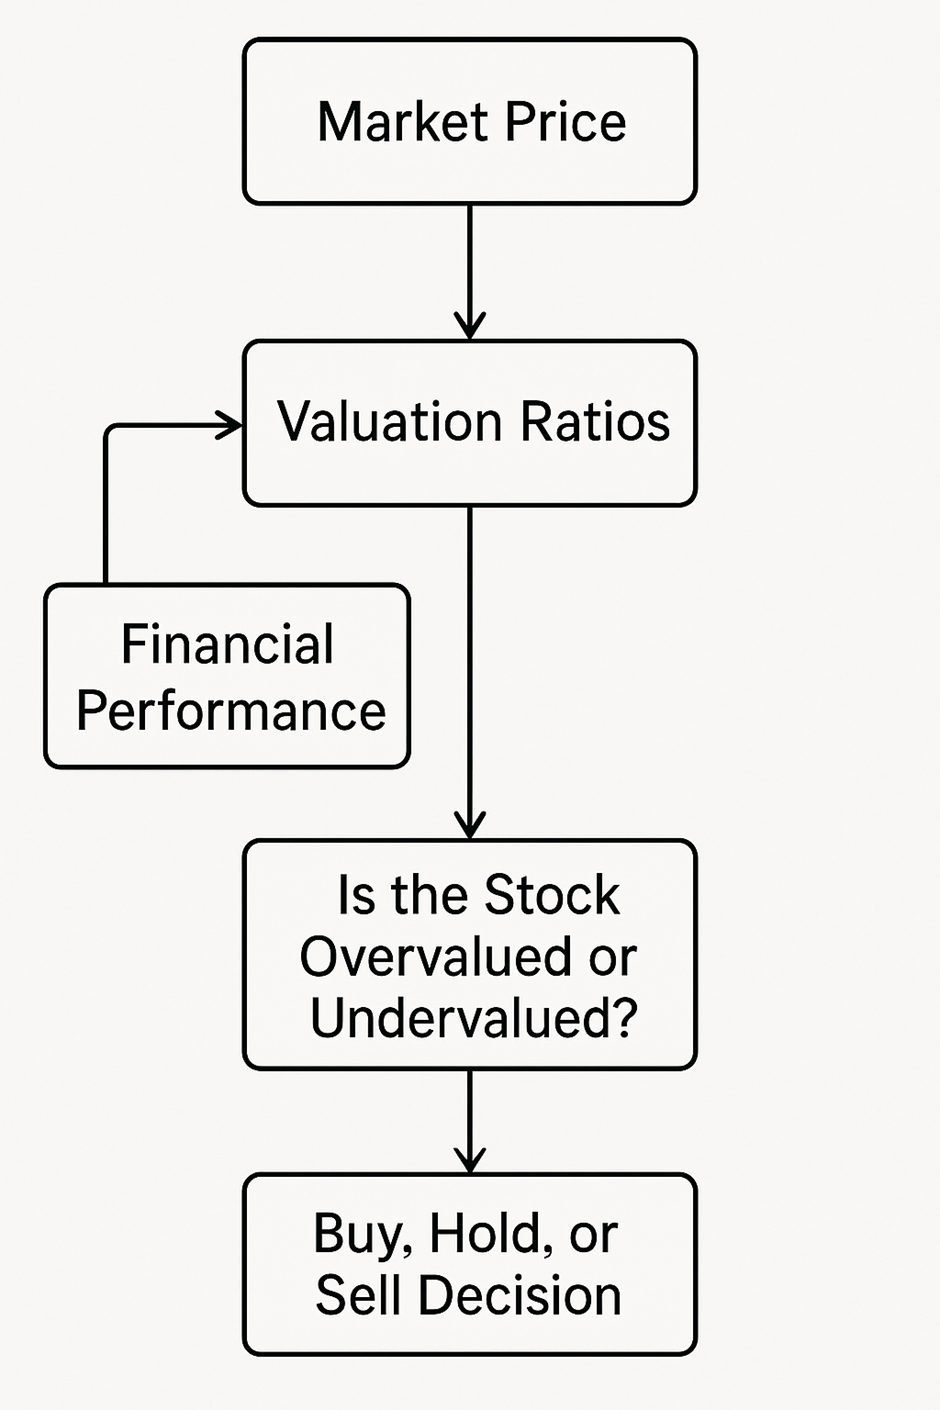
Valuation ratios are financial metrics used to assess the market value of a company relative to its financial performance, fundamentals, or assets. They help investors determine whether a stock is undervalued, fairly valued, or overvalued in relation to its earnings, book value, or cash flows.
These ratios are essential tools for:
- Stock analysts
- Portfolio managers
- Individual investors
They are commonly used in stock screening, fundamental analysis, and investment decision-making.
Why Are Valuation Ratios Important?
Valuation ratios answer the critical question: “Is the stock price justified by the company’s financial strength and potential?”
They enable investors to:
- Compare companies within the same sector
- Identify undervalued opportunities
- Avoid overpriced stocks
- Justify long-term holdings
Common Valuation Ratios
| Ratio Name | Formula | What It Measures |
|---|---|---|
| P/E (Price to Earnings) | Market Price per Share ÷ Earnings per Share (EPS) | How much the market pays for each ₹1 of earnings |
| P/B (Price to Book) | Market Price per Share ÷ Book Value per Share | Market value vs the net asset value of the company |
| EV/EBITDA | Enterprise Value ÷ EBITDA | Valuation relative to core operational earnings |
| PEG Ratio | PE Ratio ÷ Earnings Growth Rate | Valuation adjusted for growth potential |
| Dividend Yield | Dividend per Share ÷ Market Price per Share | Cash return as % of stock price |
Interpreting Valuation Ratios
| Ratio | Low Value Means… | High Value Means… |
|---|---|---|
| PE Ratio | Undervalued (or weak earnings) | Overvalued or high-growth expectation |
| PB Ratio | Stock is cheap relative to net assets | Stock trades at premium to its book value |
| EV/EBITDA | Company is relatively inexpensive | Could be overpriced or highly leveraged |
| PEG Ratio | Reasonably priced considering growth | Growth might not justify current PE |
Example Comparison
| Company | PE Ratio | PB Ratio | EV/EBITDA | PEG Ratio |
|---|---|---|---|---|
| Infosys | 27.5 | 9.3 | 17.2 | 1.8 |
| TCS | 30.1 | 14.2 | 21 | 2.1 |
| HDFC Bank | 18.6 | 2.9 | 10.3 | 1.4 |
- HDFC Bank appears more attractively valued than the IT stocks based on PE and PB.
- TCS commands a premium likely due to strong market positioning and brand.
Visual Flow: How Valuation Ratios Help Investors
Sector-Specific Benchmarks
Valuation ratios must be interpreted in context:
| Sector | Typical PE Range | Typical PB Range | Notes |
|---|---|---|---|
| IT/Software | 25 – 35 | 6 – 15 | High margins, strong earnings growth |
| Banks | 10 – 20 | 1 – 4 | Book value is key due to asset-heavy model |
| FMCG | 30 – 50 | 5 – 15 | High PE due to brand strength and pricing power |
| Infrastructure | 5 – 12 | < 1.5 | Capital-intensive, lower market valuation |
Limitations of Valuation Ratios
| Limitation | Explanation |
|---|---|
| Can be misleading in isolation | Must be compared across peers and industry |
| May ignore qualitative factors | Doesn’t factor in brand value, management quality, etc. |
| Prone to distortion | Earnings manipulation or market hype can skew ratios |
| Backward-looking | Most ratios use trailing data, may not capture future performance |
Key Takeaways
- Valuation ratios help determine whether a stock’s market price reflects its intrinsic worth.
- Key ratios include P/E, P/B, EV/EBITDA, PEG, and Dividend Yield.
- Always compare valuation ratios within the same industry or peer group.
- Use in conjunction with growth metrics, profitability ratios, and qualitative analysis.
- A low ratio doesn’t always mean “buy” and a high ratio doesn’t always mean “sell” — context is everything.