12. What is the Price-to-Earnings (P/E) Ratio?
The Price-to-Earnings (P/E) Ratio is a widely used financial metric that compares a company’s current share price to its earnings per share (EPS). It indicates how much investors are willing to pay today for ₹1 of a company’s earnings.
Formula
P/E Ratio = Market Price per Share ÷ Earnings per Share (EPS)
Example: If a company's stock is trading at ₹200 and its EPS is ₹10:
P/E Ratio = 200 ÷ 10 = 20
This means investors are willing to pay ₹20 for every ₹1 of earnings.
Why Is the P/E Ratio Important?
- Valuation: Helps assess whether a stock is overvalued, undervalued, or fairly valued.
- Growth Expectations: A high P/E indicates high growth expectations; a low P/E may signal market pessimism or a value opportunity.
- Comparative Tool: Useful for comparing similar companies within the same sector or industry.
Types of P/E Ratios
| Type | Description |
|---|---|
| Trailing P/E | Uses earnings from the last 12 months (TTM). Most commonly used. |
| Forward P/E | Uses estimated future earnings (usually next year’s EPS). Useful for projecting future value. |
Real-Life Example
| Company | Market Price (₹) | EPS (₹) | P/E Ratio |
|---|---|---|---|
| Company A | 600 | 30 | 20× |
| Company B | 600 | 60 | 10× |
- Company A is more expensive relative to its earnings than Company B.
- This could mean Company A is expected to grow faster, or Company B is undervalued.
Interpreting the P/E Ratio
| P/E Value | Meaning |
|---|---|
| High (30+) | Investors expect high future growth; may indicate overvaluation |
| Medium (15–25) | Suggests fair valuation if aligned with sector norms |
| Low (<10) | Could be undervalued or facing serious risks/problems |
Limitations of the P/E Ratio
- Not for loss-making companies: Negative EPS makes P/E meaningless.
- Doesn’t reflect growth: High P/E may still be cheap if the company is growing rapidly. (Use PEG Ratio = P/E ÷ Growth Rate)
- Sector differences: Different industries have different average P/E norms. Tech companies often have higher P/E than utilities.
- Earnings manipulation: EPS can be influenced by accounting changes, share buybacks, or non-recurring items.
Alternatives & Complements to P/E
| Metric | What It Measures | Use When... |
|---|---|---|
| PEG Ratio | P/E divided by growth rate | You want to include growth in valuation |
| EV/EBITDA | Enterprise value vs cash profits | Comparing companies with debt |
| Price-to-Book | Valuation vs net assets | Good for asset-heavy businesses |
Where It Fits in Stock Analysis
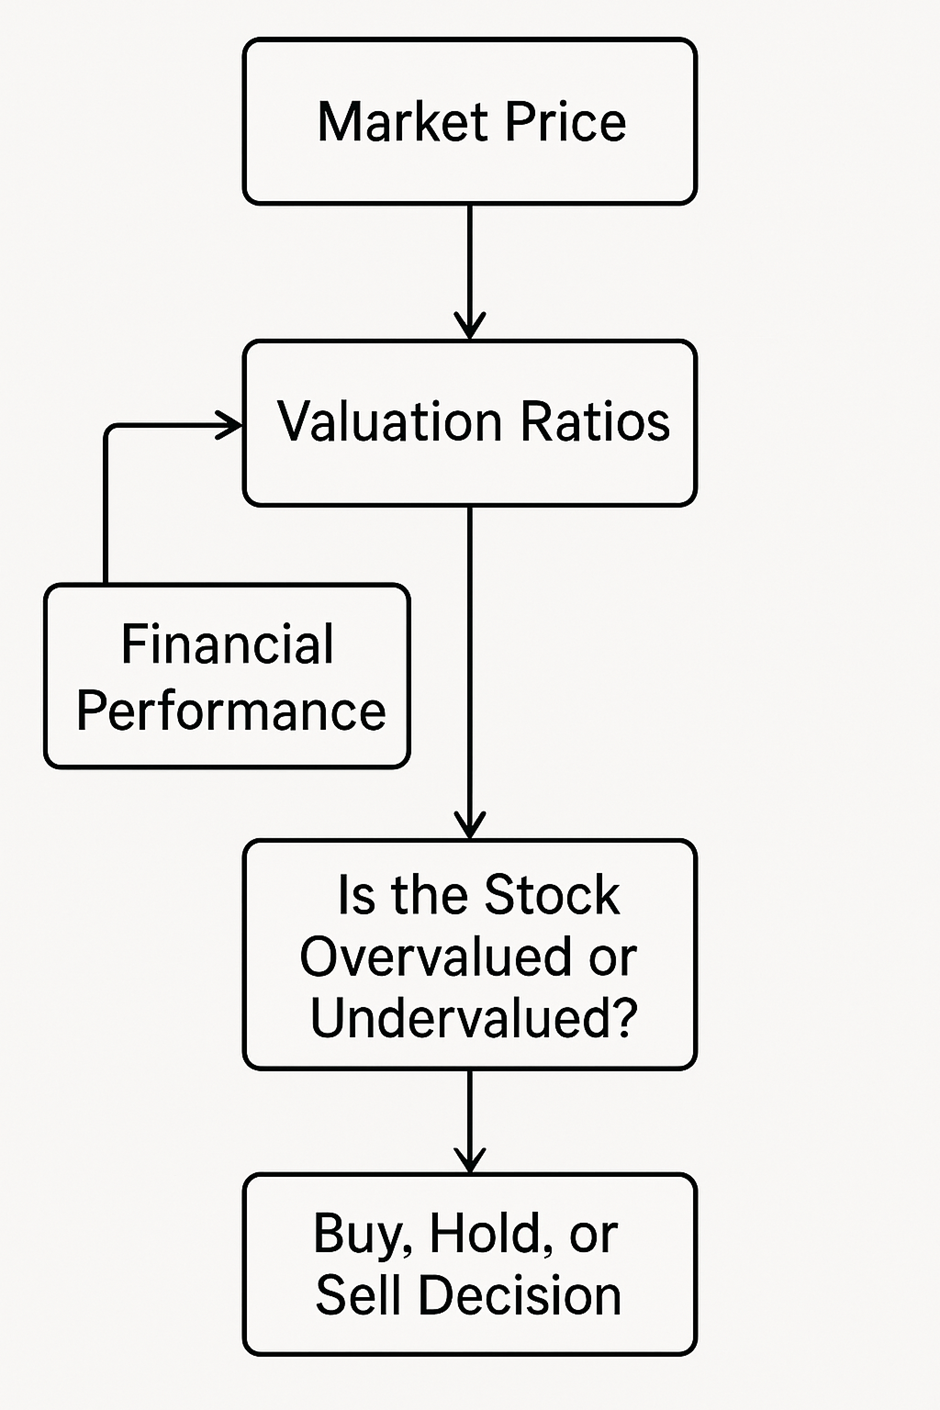
- Value investors look for low P/E stocks that might be undervalued.
- Growth investors may buy high P/E stocks if growth justifies the valuation.
Key Takeaways
- P/E Ratio measures how much investors are paying for ₹1 of a company’s earnings.
- Formula:
P/E Ratio = Market Price per Share ÷ Earning per Share (EPS)
- A high P/E reflects optimism about future growth, while a low P/E may suggest undervaluation or risk.
- Most effective when comparing companies within the same industry.
- Should not be used in isolation — combine with PEG, EV/EBITDA, and qualitative analysis for better investment decisions.