2. Why Are Financial Ratios Important for Investors?
Financial ratios are indispensable analytical tools used by investors to evaluate a company’s financial performance and investment potential. Instead of analyzing long, complex financial statements line by line, investors use financial ratios to draw meaningful insights quickly and efficiently. These ratios are derived from a company’s Balance Sheet, Income Statement, and Cash Flow Statement, and they present a standardized, quantitative view of performance across critical areas like profitability, solvency, valuation, liquidity, and efficiency.
Why Do Investors Rely on Financial Ratios?
Let’s explore the fundamental reasons that make financial ratios essential for investors:
1. Simplify Financial Data
Financial ratios condense pages of financial statements into clear, easy-to-understand numbers. They eliminate the clutter and allow investors to focus on the core financial indicators without diving deep into every line item.
2. Enable Comparability
Ratios standardize financial performance metrics, making it possible to compare:
- The same company across multiple periods (trend analysis)
- Different companies within the same sector (peer comparison)
- Company performance against industry benchmarks
Without ratios, comparisons become unreliable due to differences in company size, accounting formats, or reporting practices.
3. Assess Profitability and Growth Potential
Profitability ratios like Net Profit Margin, Return on Equity (ROE), and Return on Assets (ROA) help investors understand whether a company is generating enough earnings relative to its capital, sales, and assets. These indicators help answer:
- Is this company consistently profitable?
- Is it generating strong returns for shareholders?
- Is growth being driven by efficiency or merely revenue?
4. Evaluate Financial Health and Risk
Ratios like Debt-to-Equity and Interest Coverage allow investors to measure a firm’s solvency and risk. This helps determine:
- Is the company over-leveraged?
- Can it survive an economic downturn?
- Will it be able to meet interest obligations?
Companies with poor solvency ratios might deliver high returns in the short term but expose investors to default or bankruptcy risk in the long term.
5. Determine Valuation and Market Expectations
Valuation ratios like Price-to-Earnings (PE), Price-to-Book (PB), and EV/EBITDA show how much investors are willing to pay for each unit of earnings or book value. These ratios help investors assess:
- Is the stock overvalued or undervalued?
- Is the current market price justified by fundamentals?
- Are market expectations too high (possibly risky) or too low (opportunity)?
6. Monitor Operational Efficiency
Efficiency ratios like Asset Turnover and Inventory Turnover indicate how well the company is using its resources to generate revenue. High efficiency typically reflects:
- Lean operations
- Strong cost control
- Better inventory management
- Competitive advantage
Full Table: Types of Ratios and Their Relevance to Investors
| Ratio Category | Example Ratios | Investor Focus |
|---|---|---|
| Profitability | ROE, ROA, Net Profit Margin | Is the business financially rewarding? |
| Liquidity | Current Ratio, Quick Ratio | Can it pay short-term liabilities? |
| Leverage | Debt-to-Equity, Interest Coverage | What’s the risk level due to debt? |
| Efficiency | Asset Turnover, Inventory Turnover | Is the company maximizing its resources? |
| Valuation | PE Ratio, PB Ratio, EV/EBITDA | Is the stock attractively priced or expensive? |
Workflow: How an Investor Uses Financial Ratios
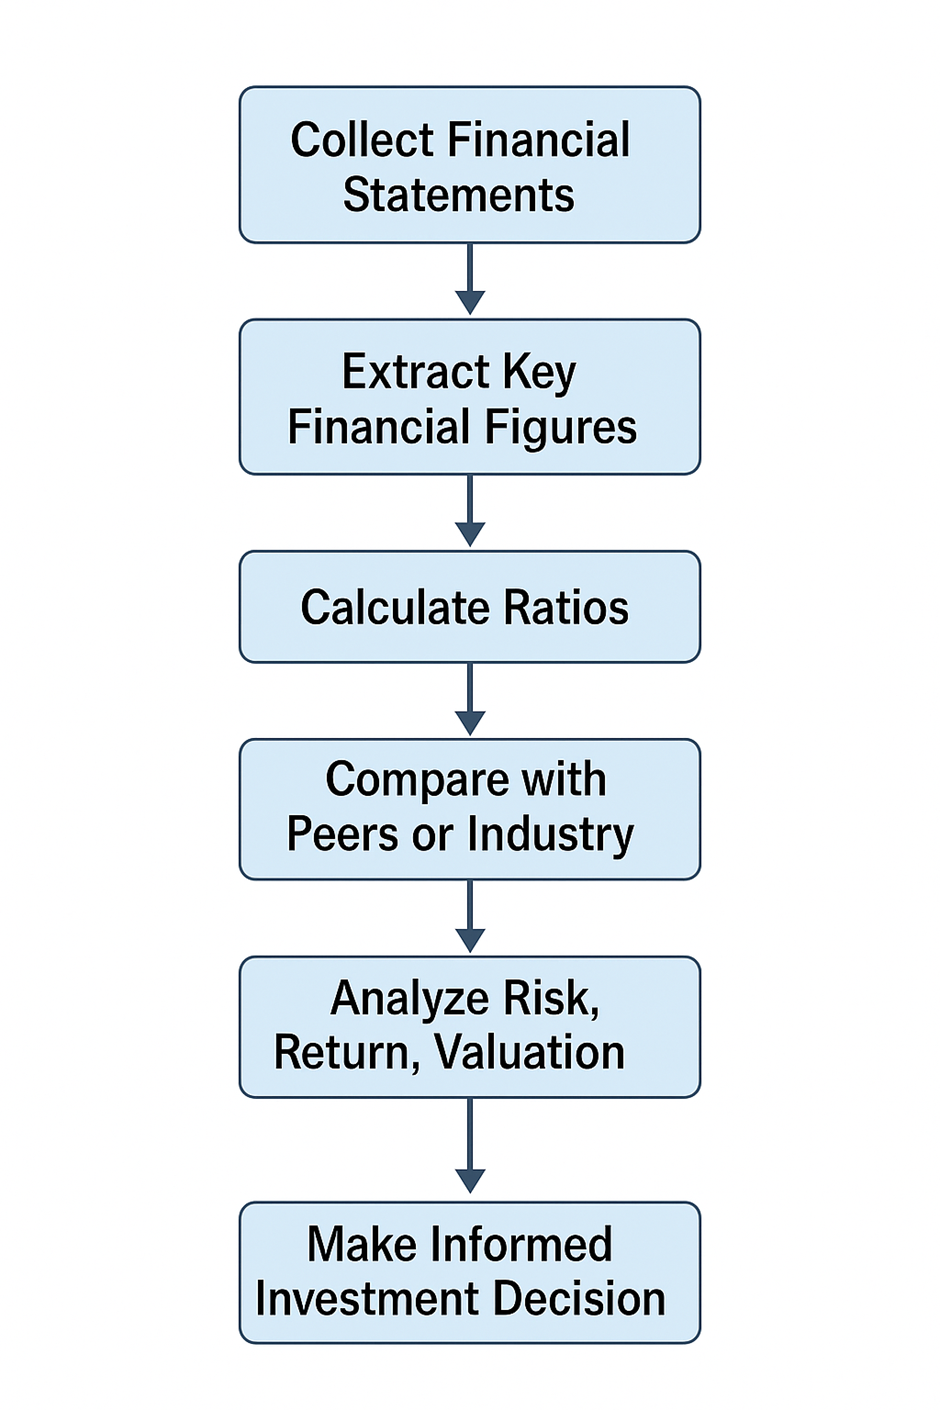
Example: Investor Analyzing Two Companies
| Metric | Company A | Company B | Insight |
|---|---|---|---|
| Net Profit Margin | 12.50% | 5.20% | Company A is more efficient in converting sales into profit |
| ROE (%) | 22.4 | 11.6 | Company A delivers stronger returns to shareholders |
| PE Ratio | 18.2 | 30.4 | Company A is cheaper; Company B might be overvalued |
| Debt-to-Equity | 0.35 | 1.2 | Company A has less financial risk |
Conclusion: Company A appears more efficient, less risky, and more attractively valued.
Real-Life Scenario: Impact on Investor Decision-Making
Let’s say an investor is choosing between two auto companies:
- Company X has high revenue but low profit margins.
- Company Y has moderate revenue but higher ROE, lower debt, and higher efficiency ratios.
Despite the higher sales of Company X, the ratios reveal that Company Y is a better-managed and more stable investment, potentially offering better long-term returns.
Pros of Using Financial Ratios
| Advantage | Explanation |
|---|---|
| Time-saving | Quickly identifies red flags and strengths |
| Objectivity | Relies on numerical data, reducing emotional bias |
| Comparability | Enables apples-to-apples comparison between companies |
| Versatility | Applicable across sectors, geographies, and company sizes |
Limitations Investors Must Consider
| Limitation | Explanation |
|---|---|
| Industry Sensitivity | A good ratio in one sector might be bad in another |
| Historical Nature | Ratios use past data; not guaranteed to reflect future |
| Accounting Policy Differences | Different accounting choices can distort comparison |
| Requires Context | A low PE ratio might also mean the market expects poor future growth |
Summary
Financial ratios are cornerstones of investment analysis. They allow investors to assess profitability, risk, valuation, and operational soundness through a numerical, standardized, and comparative lens. They don’t eliminate investment risk, but they significantly reduce it by giving a clear, structured foundation for analysis.