3. What Are Profitability Ratios?
Profitability ratios are a category of financial metrics that evaluate a company’s ability to generate income relative to its revenue, assets, equity, and operating costs. These ratios offer critical insights into a company’s operational efficiency and overall financial health. They help determine whether a business is efficiently turning inputs—like capital, labour, and raw materials—into profits, which is a core measure of success for any commercial enterprise.
Why Are Profitability Ratios Important?
Investors, analysts, lenders, and even internal management teams rely on profitability ratios to:
- Measure performance over time (trend analysis)
- Compare against competitors and industry standards (peer comparison)
- Evaluate how well management is using resources to generate income
- Make decisions related to stock valuation, debt lending, or resource allocation
Profitability Is Not Just About Earning More
It’s about how efficiently a company:
- Converts sales into profits (margins)
- Utilizes its assets (ROA)
- Rewards its shareholders (ROE)
- Manages operating costs (Operating Margin)
- Handles production or sourcing costs (Gross Margin)
In simple terms, profitability ratios tell the story behind the earnings figure reported in the financial statements.
Major Types of Profitability Ratios
Let’s break down the two primary types of profitability ratios:
| Category | Purpose | Ratios Included |
|---|---|---|
| Margin Ratios | Assess the percentage of revenue turned into profit | Gross Margin, Operating Margin, Net Profit Margin |
| Return Ratios | Measure profit relative to company assets or equity invested | ROA (Return on Assets), ROE (Return on Equity) |
Detailed Breakdown of Key Ratios
| Ratio | Formula | Meaning |
|---|---|---|
| Gross Profit Margin | (Gross Profit ÷ Revenue) × 100 | Measures how efficiently a company produces or sources goods |
| Operating Margin | (Operating Income ÷ Revenue) × 100 | Reflects efficiency of core operations (excludes financing/taxes) |
| Net Profit Margin | (Net Income ÷ Revenue) × 100 | Final profitability after all expenses, interest, and taxes |
| ROA | (Net Income ÷ Total Assets) × 100 | Evaluates how well assets are used to generate profits |
| ROE | (Net Income ÷ Shareholders’ Equity) × 100 | Measures returns to shareholders on their invested capital |
Example: Calculating Profitability Ratios
Suppose a company reports:
- Revenue: ₹1,20,00,000
- Gross Profit: ₹60,00,000
- Operating Profit: ₹30,00,000
- Net Profit: ₹18,00,000
- Total Assets: ₹80,00,000
- Shareholders’ Equity: ₹40,00,000
We can calculate:
- Gross Margin = (60,00,000 / 1,20,00,000) × 100 = 50%
- Operating Margin = (30,00,000 / 1,20,00,000) × 100 = 25%
- Net Profit Margin = (18,00,000 / 1,20,00,000) × 100 = 15%
- ROA = (18,00,000 / 80,00,000) × 100 = 22.5%
- ROE = (18,00,000 / 40,00,000) × 100 = 45%
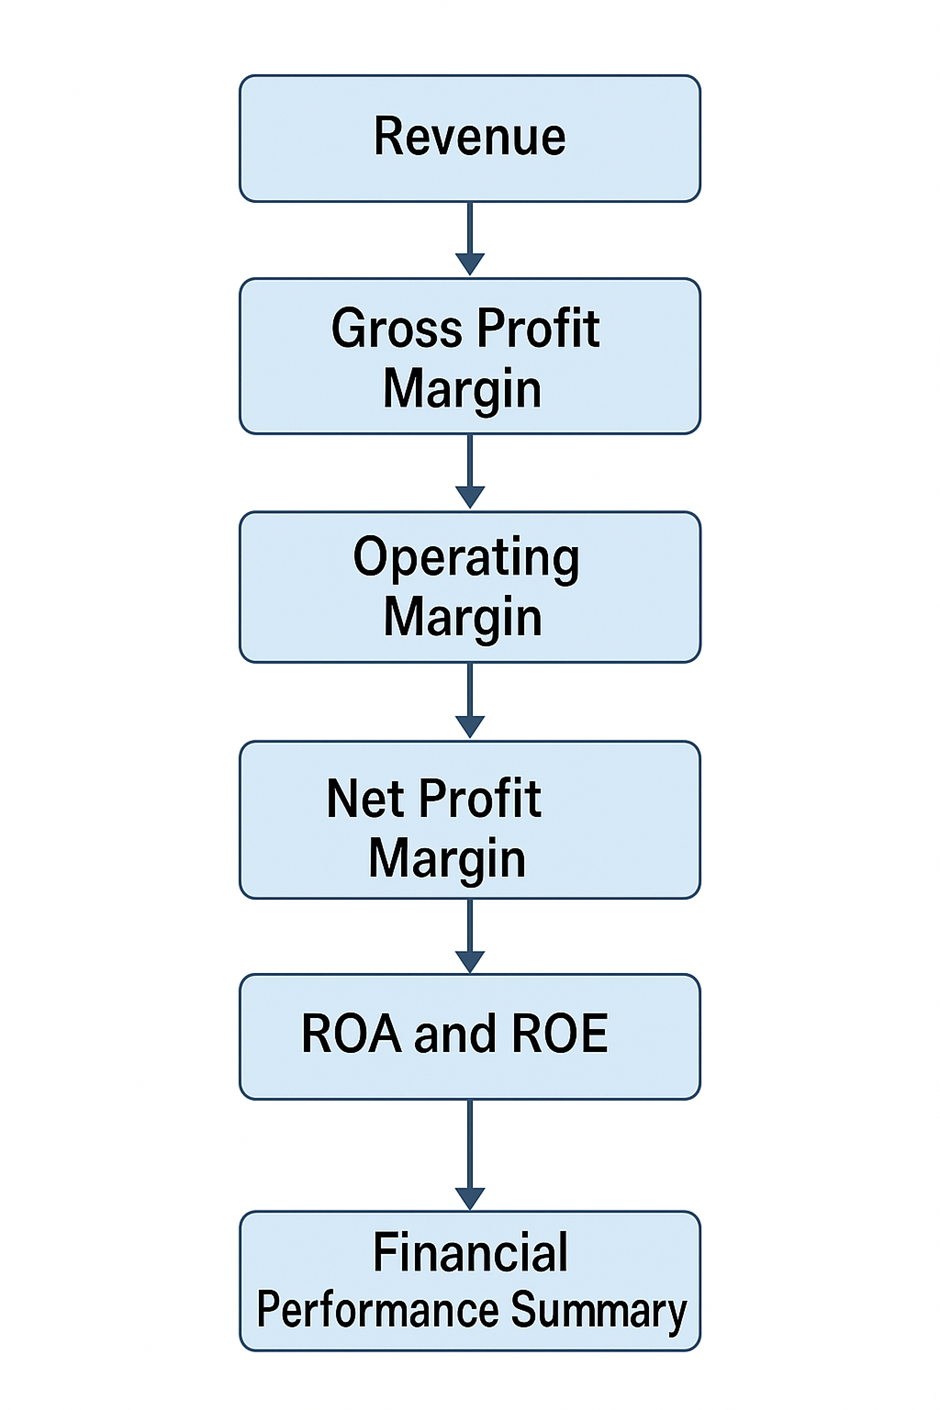
Visual Flow: How Profitability Ratios Fit into Financial Analysis
Real Company Snapshot: Infosys (FY24 Example)
| Metric | Value (%) | Interpretation |
|---|---|---|
| Gross Margin | 40% | Indicates a healthy cost structure |
| Operating Margin | 21% | Operationally efficient for a tech company |
| Net Profit Margin | 18% | Good bottom-line profit after all deductions |
| ROE | 29% | Strong shareholder return |
| ROA | 17% | Above average use of total assets |
These figures highlight profit stability, cost efficiency, and effective capital deployment.
Comparison Chart: Infosys vs Wipro
| Ratio | Infosys (%) | Wipro (%) |
|---|---|---|
| Gross Margin | 40 | 37 |
| Net Profit Margin | 18 | 14 |
| ROE | 29 | 20 |
| ROA | 17 | 13 |
Result: Infosys delivers higher profitability across the board, which may influence investor preference.
How Investors Use Profitability Ratios
| Objective | Related Ratio | What It Tells Investors |
|---|---|---|
| Assess ability to generate profit | Net Profit Margin | The percentage of revenue converted to net earnings |
| Check if operations are efficient | Operating Margin | Profitability of core business operations |
| Evaluate capital allocation | ROE | Effectiveness in generating return on equity capital |
| Analyze asset utilization | ROA | Efficiency of turning assets into profits |
Key Benefits of Profitability Ratios
| Benefit | Description |
|---|---|
| Clarity in Financial Reporting | Strips out the noise to focus on core earnings strength |
| Performance Benchmarking | Useful for comparing across sectors and peers |
| Investor Confidence | Consistent, strong ratios attract long-term investors |
| Early Warning System | Falling margins or returns may signal cost or demand issues |
Limitations to Keep in Mind
| Limitation | Impact |
|---|---|
| Doesn’t Reflect Cash Flow | A profitable firm may still face liquidity problems |
| Industry Variation | Ratios should be benchmarked within the same sector |
| Impacted by Accounting Choices | Depreciation, tax treatments can affect outcomes |
| Short-Term Volatility | One-time gains or losses can distort ratio readings |
Key Takeaways: Profitability Ratios
- Insight Beyond Profit: Profitability ratios go beyond simply showing profit—they explain how profit is generated and why it changes.
- Measure Operational Efficiency: They highlight how well a company controls costs and uses resources to generate income.
- Evaluate Capital Effectiveness: Ratios like ROE and ROA show how effectively equity and assets are turned into profits.
- Essential for Comparisons: These ratios allow consistent comparison across companies, sectors, and time periods.
- Best Used Together: No single ratio is sufficient—use a combination for a comprehensive view of financial performance.