10. What is Volume and Why is It Important?
Volume refers to the total number of shares or contracts traded for a particular stock, index, or asset during a given period (daily, hourly, etc.). It is one of the most crucial indicators in technical analysis because it reflects the strength and participation behind price movements.
> “Price tells you what’s happening. Volume tells you how strongly it’s happening.”
What Does Volume Represent?
- Each buy and sell transaction contributes to volume.
- Higher volume = More traders/investors involved
- Lower volume = Weak participation or indecision
Why is Volume So Important in Technical Analysis?
| Reason | What It Tells You |
|---|---|
| Confirms Trend Strength | A rising stock with rising volume = strong trend |
| Signals Reversals | Volume spikes at tops/bottoms may indicate exhaustion or reversal |
| Validates Breakouts | Breakouts on high volume = genuine; low volume = likely false breakout |
| Shows Interest Level | High volume = strong market interest or news impact |
| Divergence Clues | Price moving up but volume falling? Trend may be weakening |
Example: Interpreting Volume During Price Moves
| Scenario | Interpretation |
|---|---|
| Price rises on high volume | Strong breakout — buyers fully support the move |
| Price rises on low volume | Weak breakout — may not sustain, possible reversal |
| Price falls on high volume | Strong selling — exit or short the stock |
| Price falls on low volume | Temporary dip or healthy correction |
Volume on a Chart
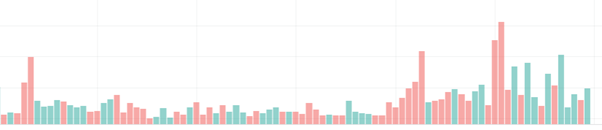
- Volume is usually shown as vertical bars at the bottom of a price chart.
- Each bar shows how much volume was traded during that candle or time period.
Interpretation:
- A large green candle on high volume = bullish confirmation
- A red candle on high volume = bearish confirmation or panic selling
Volume as a Confirmation Tool
Volume works best when used with other technical signals:
| Signal | What Volume Confirms |
|---|---|
| Breakouts | Is the breakout genuine or false? |
| Candlestick patterns | Is the reversal strong or weak? |
| Moving Average Crossovers | Are buyers/sellers stepping in with conviction? |
| Trendlines or Support Zones | Does volume rise near bounce or breakout levels? |
Low Volume = Warning Sign
- Low volume + big price moves = suspicious
- May indicate lack of commitment or false signal
- Avoid major trades unless volume supports the setup
Quick Comparison: High vs Low Volume
| High Volume | Low Volume |
|---|---|
| Strong conviction & trend support | Weak or uncertain movement |
| Often linked with breakouts | Often linked with consolidation |
| High institutional involvement | Mostly retail/intraday action |
| Clearer entry/exit signals | Risk of false signals |
Key Takeaways
- Volume = activity: Shows how many shares/contracts are being traded.
- Confirms the strength of price action — strong moves need strong volume.
- Used to validate breakouts, reversals, trends, and momentum.
- Low volume = caution. High volume = confidence.
- Always combine volume with price action and indicators for smarter decisions.