9. What is a Breakout?
A breakout occurs when the price of a stock or index moves decisively above a resistance level or below a support level, often accompanied by high trading volume. Breakouts signal that the previous range-bound movement has ended and a new trend may be starting.
> Think of a breakout like a pressure release — the stock has been “stuck” in a range, and now it's finally breaking free, leading to sharp price movement.
Types of Breakouts
| Type | Description |
|---|---|
| Bullish Breakout | Price breaks above resistance |
| Bearish Breakdown | Price breaks below support |
Why Are Breakouts Important?
- Indicate a shift in market sentiment
- Signal entry points for momentum traders
- Often lead to high-risk, high-reward moves
- Can confirm trend continuation or reversals
Real-Life Example – Bullish Breakout
ABC Ltd. has been trading between ₹490 and ₹510 for 3 weeks. Suddenly, it breaks above resistance:
| Date | High | Volume | Action |
|---|---|---|---|
| May-05 | ₹512 | 3× average | Breaks above ₹510 |
| May-06 | ₹518 | Strong follow-through | Trend starts forming |
> The breakout above ₹510 on high volume indicates strong buying interest and a new uptrend.
Example – Bearish Breakdown
XYZ stock has support at ₹280. If the price breaks below ₹280 with heavy selling, it can trigger panic selling, driving the stock down to the next support zone (e.g., ₹250).
Key Characteristics of a Strong Breakout
| Signal | What It Means |
|---|---|
| High Volume | Confirms participation and strength |
| Clean Candle Close | Price closes clearly above resistance |
| Sustained Move | Follows through over the next few sessions |
| Retesting the Level | Price retests old level as new support/resistance |
Breakout Chart Example (Bullish)
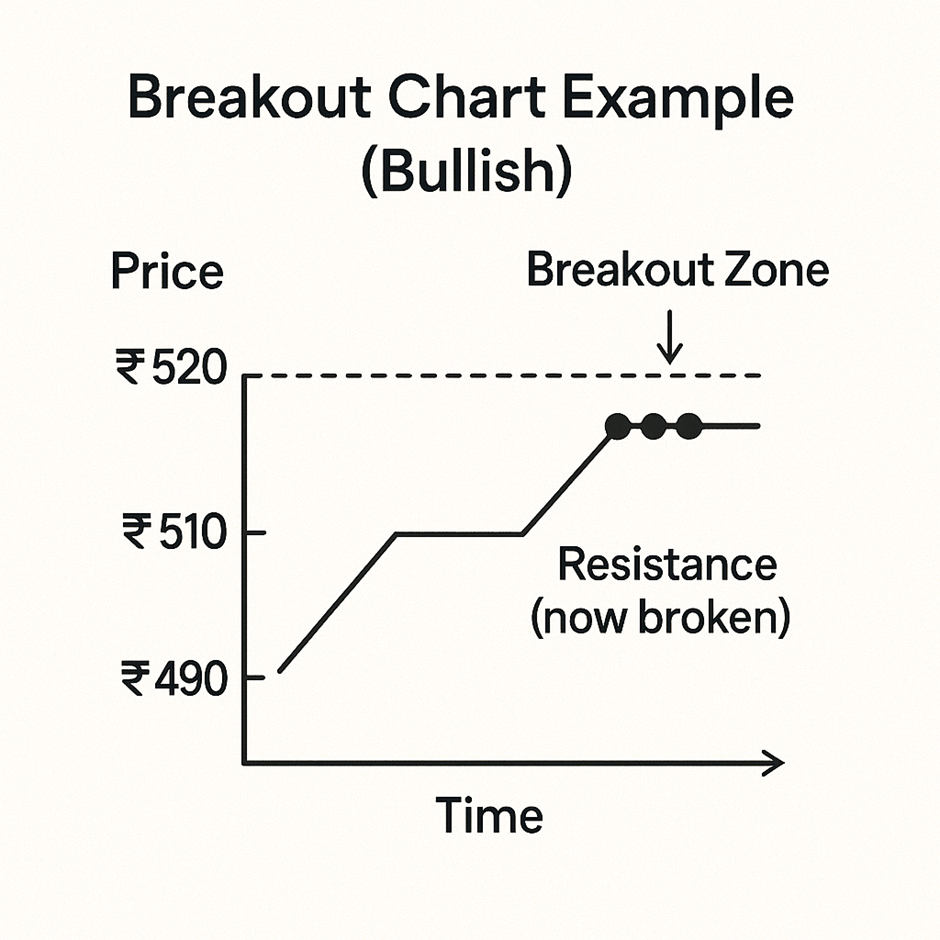
> Post-breakout, the stock may either run up quickly (momentum breakout) or retest the old resistance (now support) before continuing higher.
Role Reversal in Breakouts
A key principle in breakout trading: “Old resistance becomes new support and vice versa.”
Example:
- Stock breaks ₹510 resistance → rises to ₹530
- Pulls back to ₹510 → now holds as support before continuing upward
Breakout vs. False Breakout
| True Breakout | False Breakout |
|---|---|
| Strong volume | Low volume |
| Sustained move | Reverses quickly |
| Closes outside resistance | Moves briefly and pulls back |
| Leads to trend formation | Traps traders and whipsaws prices |
> Avoid false breakouts by waiting for a confirmation candle + volume surge.
Common Breakout Patterns
- Ascending triangle → Bullish breakout
- Descending triangle → Bearish breakdown
- Rectangle pattern → Range breakout
- Cup and handle → Bullish continuation
- Head & shoulders → Reversal breakouts
How Traders Use Breakouts
- Entry Trigger: Enter when price breaks key levels
- Stop-Loss: Just below breakout (bullish) or above (bearish)
- Target: Measured using pattern height or nearest resistance/support
Key Takeaways
- Breakout = price crossing a significant resistance or support level
- High volume is crucial for validation
- Can lead to explosive moves with high reward potential
- Be cautious of false breakouts — wait for confirmation
- Breakouts often mark the beginning of new trends