8. What is a Resistance Level?
A resistance level is a key concept in technical analysis that refers to a price point at which a stock or index repeatedly struggles to move above. This happens because sellers become more active — booking profits, exiting trades, or initiating short positions.
> Think of resistance as an invisible ceiling. The price keeps bumping into it, but can't break through — unless there's enough buying pressure.
Why Does Resistance Happen?
Resistance is not random. It forms due to:
- Profit Booking – Early investors sell to lock in gains, creating selling pressure
- Previous Highs – Traders remember past reversals and sell again at the same level
- Round Numbers – Psychologically significant levels like ₹500, ₹1000, ₹1500 act as barriers
- Institutional Selling – Big institutions offload large volumes near target prices, causing short-term reversals
Real-Life Example: Resistance in Action
Assume Infosys Ltd. faces heavy selling near ₹1,650 over several trading sessions:
| Date | High Price | Outcome |
|---|---|---|
| April 2 | ₹1,650 | Rejected, falls to ₹1,610 |
| April 5 | ₹1,648 | Rejected, falls again |
| April 9 | ₹1,652 | Rejected, falls to ₹1,625 |
From this pattern, ₹1,650 is established as a strong resistance level — a zone where sellers dominate.
Visual Representation
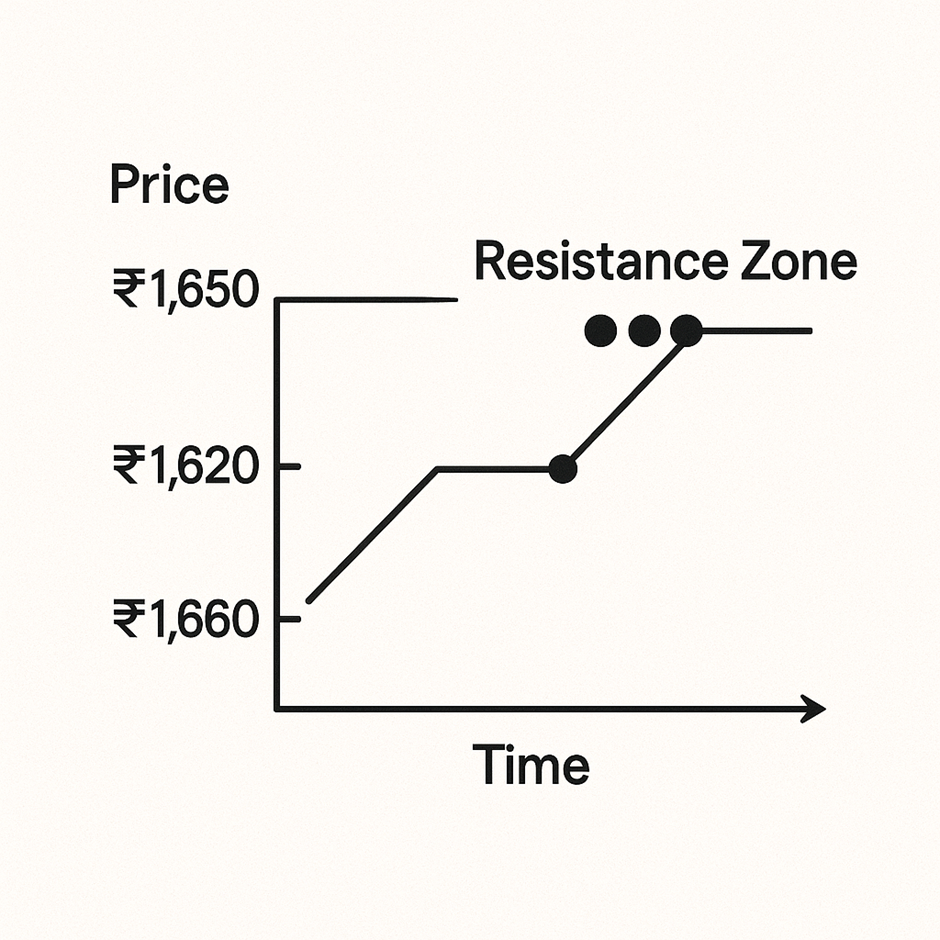
Every time the stock nears ₹1,650, it gets pushed back down, confirming seller dominance.
How Traders Use Resistance Levels
| Trading Objective | How Resistance Helps |
|---|---|
| Exit Long Positions | Sell before price faces resistance and reverses |
| Enter Short Positions | Initiate short trades anticipating rejection |
| Set Targets | Place profit targets just below resistance |
| Trade Breakouts | Buy if price breaks above resistance on high volume |
| Stop-Loss Planning | Short trades use resistance zone as stop-loss |
Example: A trader shorts Infosys at ₹1,648 with a stop-loss at ₹1,660, aiming to cover near ₹1,600.
What If Resistance Breaks?
If the price breaks above resistance with strong volume, it indicates:
- Renewed buying strength / bullish sentiment
- A potential uptrend or breakout rally
- The previous resistance may become new support (role reversal)
Scenario: Infosys breaks out above ₹1,650 → surges to ₹1,720. Later, ₹1,650 acts as support → a buy-the-dip opportunity.
Support vs Resistance: Quick Comparison
| Aspect | Support | Resistance |
|---|---|---|
| Role | Price floor | Price ceiling |
| Price Action | Price tends to bounce up | Price tends to bounce down |
| Dominant Force | Buyers | Sellers |
| Used For | Buying zones, stop-loss placement | Profit booking, shorting opportunities |
| Can Switch Roles? | Becomes resistance if broken | Becomes support if broken |
Common Resistance Signals
- Repeated failures to break a certain level
- Long upper wicks (candlestick shadows) near that price
- Decreasing volume near resistance (weak buying)
- Reversal candlestick patterns (shooting star, bearish engulfing)
Pro Tip: Combine Resistance with Indicators
Using indicators with resistance gives higher accuracy:
- RSI near 70 → Overbought near resistance = stronger reversal
- MACD bearish crossover near resistance = early sell signal
- Volume spike on breakout = likely to sustain move above resistance
Key Takeaways
- Resistance is the level where price tends to stop rising due to increased selling activity
- It’s a strategic level for profit booking or entering short trades
- If resistance holds, prices may reverse downward
- If resistance breaks, it may turn into support (role reversal) and trigger a breakout
- Resistance zones become more reliable when tested multiple times and confirmed by volume and indicators